
Handwritten digit classification using K-nearest neighbors algorithm
Introduction
One of the most important aims of machine learning is to classify data into classes. For example, classifying an email to be spam or ham, a tumor is a malignant or benign, or classifying handwritten digits into one of the 10 classes.
K-Nearest Neighbors
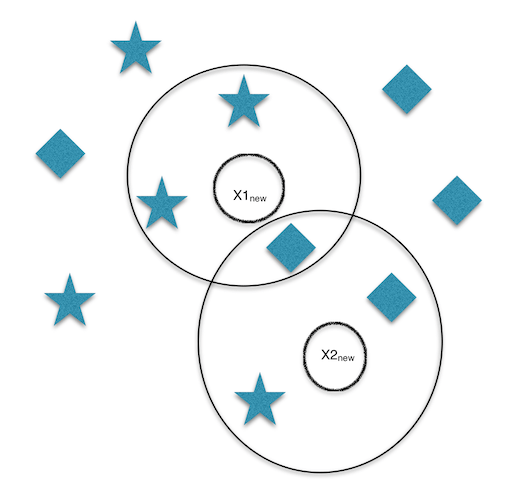
In a nutshell, Suppose we have N training objects each of them represented by a vector "x" and a label "c" to classify a new object xnew with K-nearest neighbors we find the K training points that are close to xnew and then assign "c" to the majority class amongst these neighbors.
For instance, Stars and diamonds donate training points and X1new and X2new donate testing points. When choosing K=3, X1new will be assigned to the star class and X2new will be assigned to the diamond class.
I will explain using an exercise from Bayesian Reasoning and Machine Learning book chapter 14: from here.
Tools:- Octave or Matlab. I used Octave, you can download from here.
- BRMLtoolbox you can download from here , I used the non-OO code.
Exercise 14.1. The file NNdata.mat contains training and test data for the handwritten digits 5 and 9. Using leave one out cross-validation, find the optimal K in K-nearest neighbors, and use this to compute the classification accuracy of the method on the test data.
Dataset Description
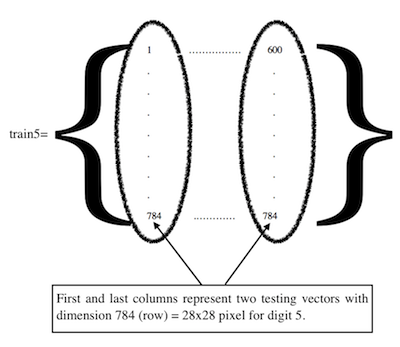
In this exercise we have dataset for digits 5 and 9 composed of test and training matrices for each. Each training matrix has a size of 784x600 containing 600 columns represent training objects and rows representing a digit with 784 (28x28) pixels. Each test matrix has a size of 784x292 containing 292 (columns) represent test objects and rows representing a digit with 784 (28x28) pixels. you can see the contents of NNdata.mat file using the following commands.
>> load("./data/NNdata.mat")
>> whos
Variables in the current scope:

   Attr Name        Size                     Bytes  Class
   ==== ====        ====                     =====  =====
        test5     784x292                  1831424  double
        test9     784x292                  1831424  double
        train5    784x600                  3763200  double
        train9    784x600                  3763200  double

Total is 1398656 elements using 11189248 bytes
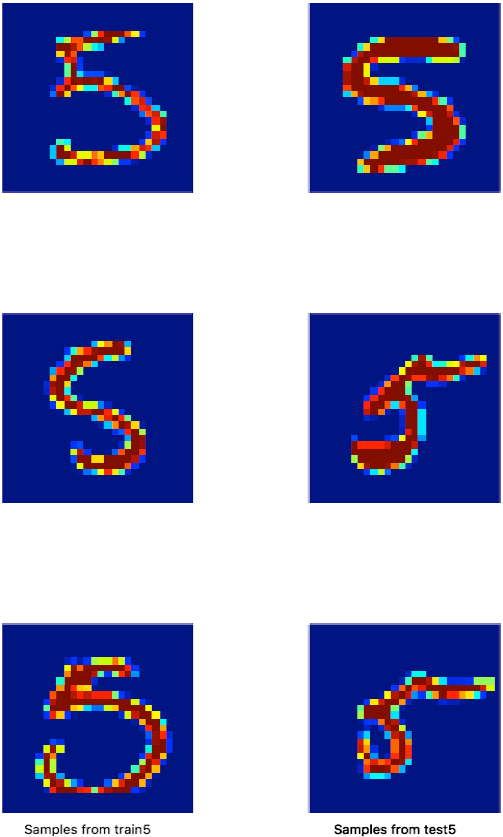
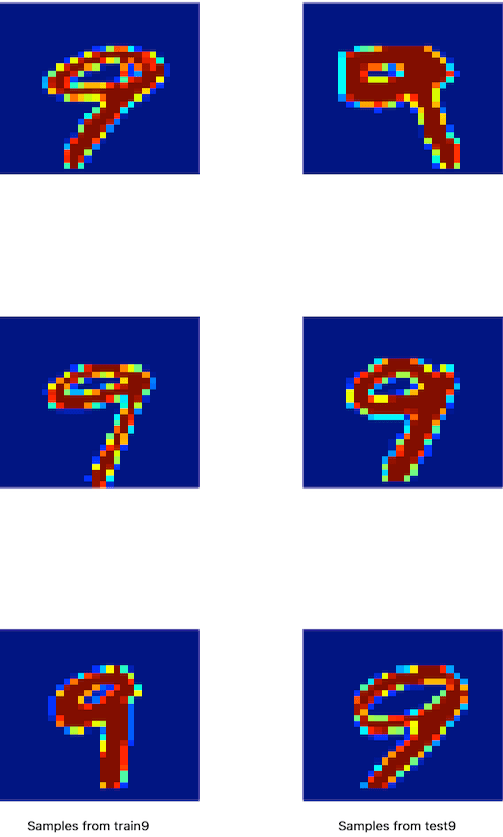
Here is some samples from train5, train9, test5, and test9 arrays. I used the code below to generate image for train and test class 5.
data=load('./data/NNdata.mat'); % load training and testing data

train5=data.train5;  % class 5 training data for digit 5
train9=data.train9;  % class 9 training data for digit 9

test5=data.test5; % test data for digit 5
test9=data.test9; % test data for digit 9

subplot (4, 2, 1);
imagesc(reshape (data.train5(:,2),28,28)');

subplot (4, 2, 2);
imagesc(reshape (data.test5(:,20),28,28)');

subplot (4, 2, 3);
imagesc(reshape (data.train5(:,110),28,28)');

subplot (4, 2, 4);
imagesc(reshape (data.test5(:,222),28,28)');

subplot (4, 2, 5);
imagesc(reshape (data.train5(:,61),28,28)');

subplot (4, 2, 6);
imagesc(reshape (data.test5(:,145),28,28)');
After understating the dataset structure, let's start the solution. The first requirement is to define the optimal K using leave one out cross validation and then calculate the accuracy of the algorithm on test data.
BRMLtoolbox has a method nearNeigh(traindata, testdata, trainlabel, k). Next table describes each input parameter of nearNeigh function.
| Parameter | Definition |
| traindata | Matrix with each column a training vector. |
| testdata | Matrix with each column a test vector. |
| trainlabel | Vector of length size(traindata,2) of training labels. |
| k | Number of nearest neighbors. |
| output | Vector of expected labels for test vectors. |
Leave one out cross validation (LOOCV)
In this validation schema, the dataset is divided into subsets equal to N, the number of data points in the set. That means that N separate times, the function approximator is trained on all the data except for one point and a prediction is made for that point.
Steps of leave one out cross validation:- Initialize a counter for error.
- Pick one train object with its label from a data matrix contains train5 and train9 and the correspondent label matrix.
- Remove this object and its label from the two matrices.
- Predict that object with the matrix except this element.
- If the predicted label does not equal to the known label "5 or 9", increment the error counter.
- Do the same for all objects in the matrix.
- Iterate these steps over different K values. This step may consume a lot of time for large value of k.
- Choose the optimal K that has the smallest error counter.
After choosing the optimal K value from the output of LOOCV, testing phase has came with this K value.The test5 and test9 matrices are used، if the expected label of each vector of test data does not equal to the exact label, increment an error counter. After finishing measure the accuracy of classification by this formula (number of test objects - total error)/ number of test objects x 100%
The code
This code depends on dataset file and other files you can get them from github repository from here.
data=load('./data/NNdata.mat'); % load training and testing data

train5 = data.train5;  % class 5 training data for digit 5
train9 = data.train9;  % class 9 training data for digit 9

test5 = data.test5; % test data for digit 5
test9 = data.test9; % test data for digit 9

traindata = [train5  train9];
trainlabel = [5*ones(1,600), 9*ones(1,600)];

% Find the optimal K
totalerror = [];
for ks = 1:20
  error = 0;
      for t5 = 1:1200
           temp5label = trainlabel;
           temp5 = traindata;
           traindata(:,t5) = [];
           trainlabel(t5) = [];
           y5 = nearNeigh(traindata,temp5(:,t5) , trainlabel,ks); % find nearest

             if(y5~=temp5label(t5))
                error++;
             end % end if

           traindata = temp5;
           trainlabel = temp5label;
      end % end iterating samples
  totalerror = [totalerror error];
  disp(strcat('For k= ', num2str(ks) ,' Error = ' , num2str(error)));
end   %k for loop

kvalues = 1:20;
temperror = totalerror;
minerror = find(temperror==min(temperror));
bestk = kvalues(minerror);
disp(strcat('Best k= ', num2str(bestk)));

%% Get classification accuracy for best k
error5 = 0;
error9 = 0;

testout5 = nearNeigh(traindata,test5 , trainlabel,bestk); % find nearest
testout9 = nearNeigh(traindata,test9 , trainlabel,bestk); % find nearest

 for i = 1:292
     if(testout5(i)~=5)
       error5++;
     end % end if
     if(testout9(i)~=9)
       error9++;
     end % end ifd
 end%% end for

 accuracy = ((584-(error5+error9))/584)*100;
disp(strcat('Accuracy= ', num2str(accuracy),'%'));

%% Print chart between different values of keys (x) and Errors (y)
figure; hold on;
plot(kvalues,totalerror);
set(gca, "ylabel", text("string", "Error", "fontsize", 25));
set(gca, "xlabel", text("string", "K values", "fontsize", 25));
set(gca, "xtick", [1:20]);
Output
>>
For k=1 Error =22
For k=2 Error =22
For k=3 Error =21
For k=4 Error =26
For k=5 Error =28
For k=6 Error =29
For k=7 Error =29
For k=8 Error =32
For k=9 Error =32
For k=10 Error =35
For k=11 Error =35
For k=12 Error =36
For k=13 Error =37
For k=14 Error =41
For k=15 Error =42
For k=16 Error =44
For k=17 Error =47
For k=18 Error =50
For k=19 Error =52
For k=20 Error =54
Best k=3
Accuracy=97.603%
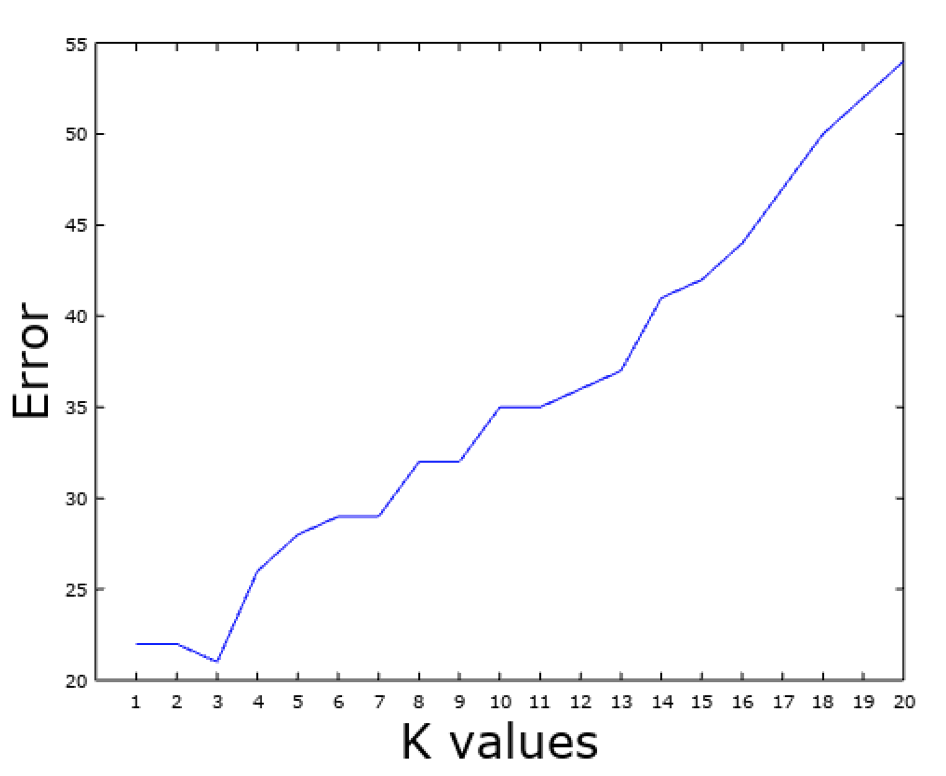
From the above results, optimal K value is 3 and the classification accuracy is 97.603%.